Sentiment Analysis
Sentiment type
Let’s start off with understanding the terms polarity and subjectivity in sentiment analysis. Polarity refers to the strength of an opinion, it could be either positive or negative. It varies between -1 and +1 and the strength of the polarity depends on various factors and situations under which these tweets are posted. Subjectivity refers to the degree to which a person is personally involved in a topic. What matters the most here are personal connections and individual experiences pertaining to the topic. From our line graph of polarity and subjectively along with total number of tweets, we can without doubt tell that, most tweets are more subjective, which we think is a good indicator as this means that people are basing their opinions towards vaccine depending on their personal experiences and not being sweets away by median content circulating against the vaccine. This is also a good indicator as this would mean, we governments communicating with these populations who might not be very keen on vaccinating themselves will be able to create awareness and educate them and they don’t necessarily have to be worried about public opinion being swayed by misinformation on vaccines.
We also used carto to visualize the distribution of polarity and subjectivity across US States.
Emotional type
Then we perform emotional analysis with NRCLex on primary emotion types, such as fear, anger, anticipation, trust, surprise, positive, negative, neutral, sadness, disgust and joy.
from nrclex import NRCLex

def emotion(x):
    text = NRCLex(x)
    if text.top_emotions[0][1] == 0.0:
        return "No emotion"
    else:
        return text.top_emotions[0][0]

import nltk
import string
senti_data['Emotion'] = senti_data['text'].apply(emotion)
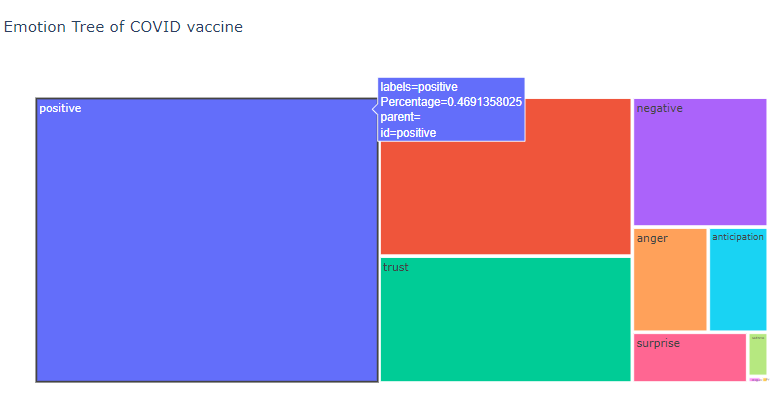
From our emotional tree created by Ploty, 46% of the tweets are express positively towards the vaccine, that is almost half the tweets. Following positive emotion, is fear and trust being the at 19% and 15% respectively. Our analysis is not very clearly indicating the nature of the trust if its positive or trust against the vaccine and hence we are not able to fully comment on it. 19% fear the vaccine is something of concern and would be helpful to have some educational and awareness programs to help this segment.
From our Emotional line graph, we can tell the reaction had been very positive overall till June 2021 and October 2021, the overall emotion of the tweets during the period seems to be very confusing as we don’t see any of emotional being very prevalent.
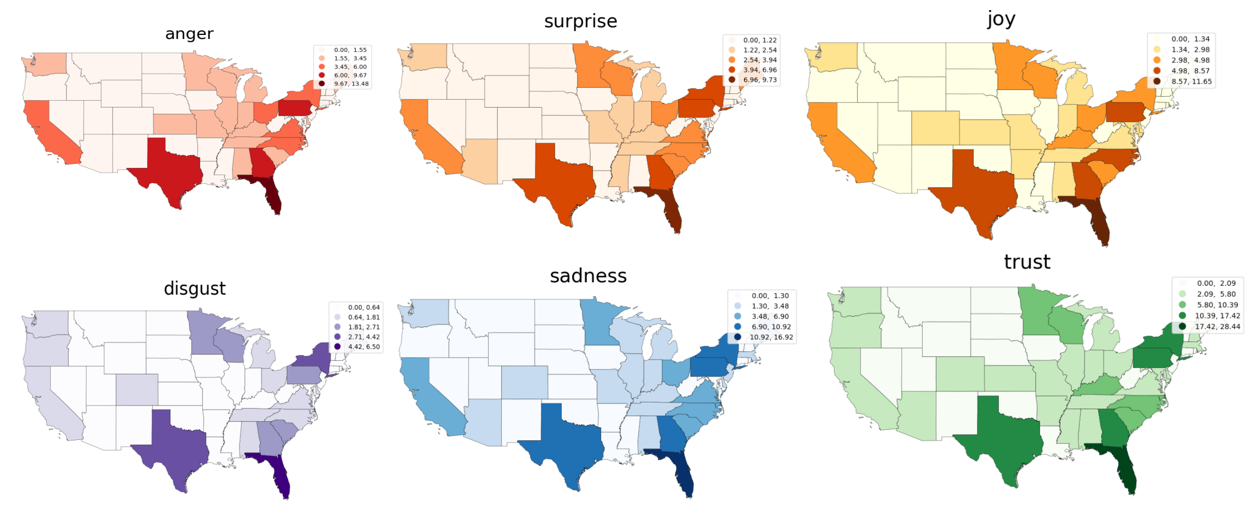
Then emotional maps are created. The geographic data of US is collected from GISMAP. Tweet data is processed and joined with US map.
- See the code for Sentiment Analysis and emotional maps for the code that produced these plots.